Deduction Activity Analysis
The Deduction Activity Analysis dashboard provides the trends of the activities of analysts involved in the deductions resolution process for the last 12 months.
For more details, refer to Viewing Dashboards.
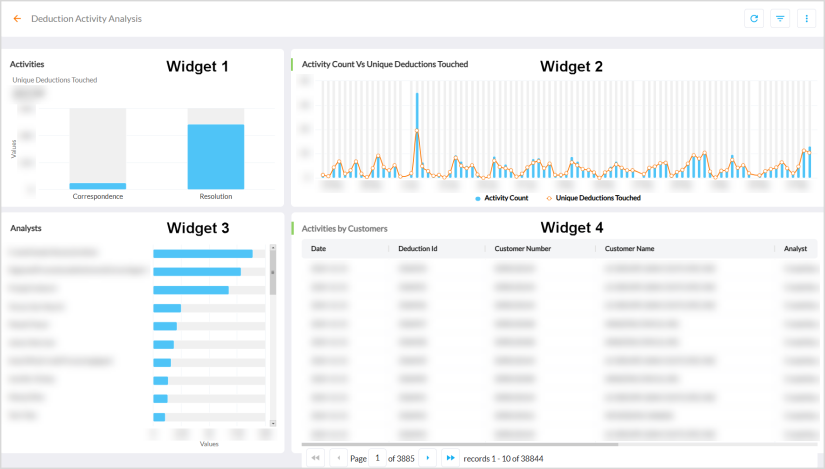
Widget 1 - Activities
The Activities widget displays a column chart of various deductions activities of analysts.
Hovering over the series displays a tooltip![]() A tooltip is used to specify extra information about something when the user moves the mouse pointer over an element. of the activity type and the respective value of Activity Count.
A tooltip is used to specify extra information about something when the user moves the mouse pointer over an element. of the activity type and the respective value of Activity Count.
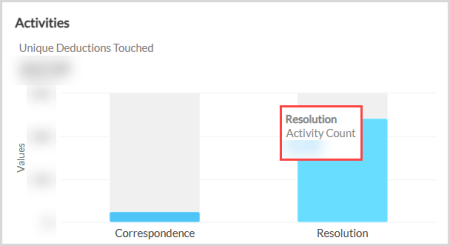
Widget 2 - Activity Count Vs Unique Deductions Touched
The Activity Count Vs Unique Deductions Touched widget displays a column and spline chart of the count of deduction activities and deductions worked by analysts.
Hovering over the series displays a tooltip of date and the respective Activity Count and Unique Deductions Touched values.
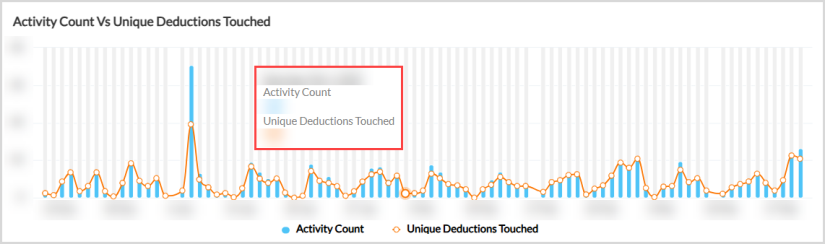
Widget 3 - Analysts
The Analysts widget displays a bar chart of the deduction activities count of analysts.
Hovering over the series displays a tooltip of analyst and the respective Activity Count value.
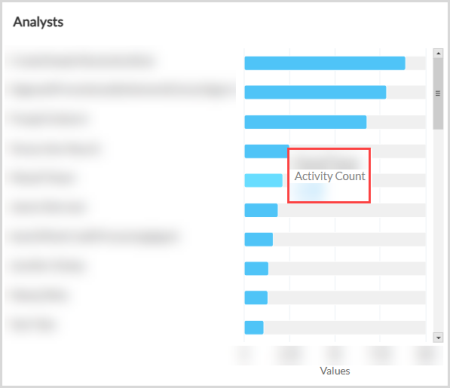
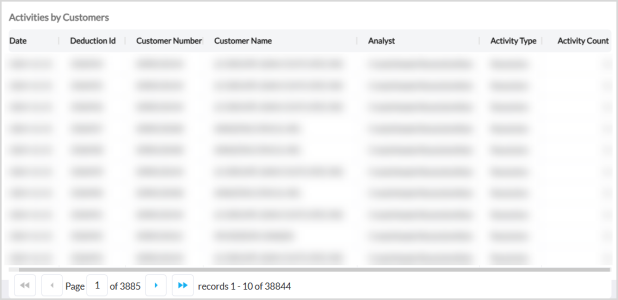
Widget 4 - Activities by Customers
The Activities by Customers widget displays the entire data considered for the computation of metrics in the dashboard.
Out-of-the-Box Features
The Out-of-the-Box features and functionalities of the dashboard are as follows:
-
Cross Filtering - Slices and dices between multiple dimensions. For example, clicking a processor in the Processor widget, filters the entire data of dashboard for that processor.
-
Standard Out-of-the-Box Filters - Filters the entire dashboard based on Company Code, Reason Code, Processor, and Owner.
-
Kebab Menu - Click this icon to access options such as download, schedule, and mark the report as favorite. For more details, refer to Using Kebab Menu Options.